Metrics Were Measured, But Rhythm Wasn't Designed
[Sequence Log 009]
Measurements Were Made, But Rhythm Wasn’t Designed
– Recording Garmin 가민 Body Battery and Stress Index for a week
1. Introduction
I wanted to design a sustainable rhythm for life
The goal wasn’t to improve performance or push limits.
I wanted to create a sustainable state for exercise, nutrition, and sleep.
I expected wearable metrics to help with that design.
But the gap between numbers and perception kept recurring.
2. Purpose and Method of the Experiment
This wasn’t an experiment to verify accuracy
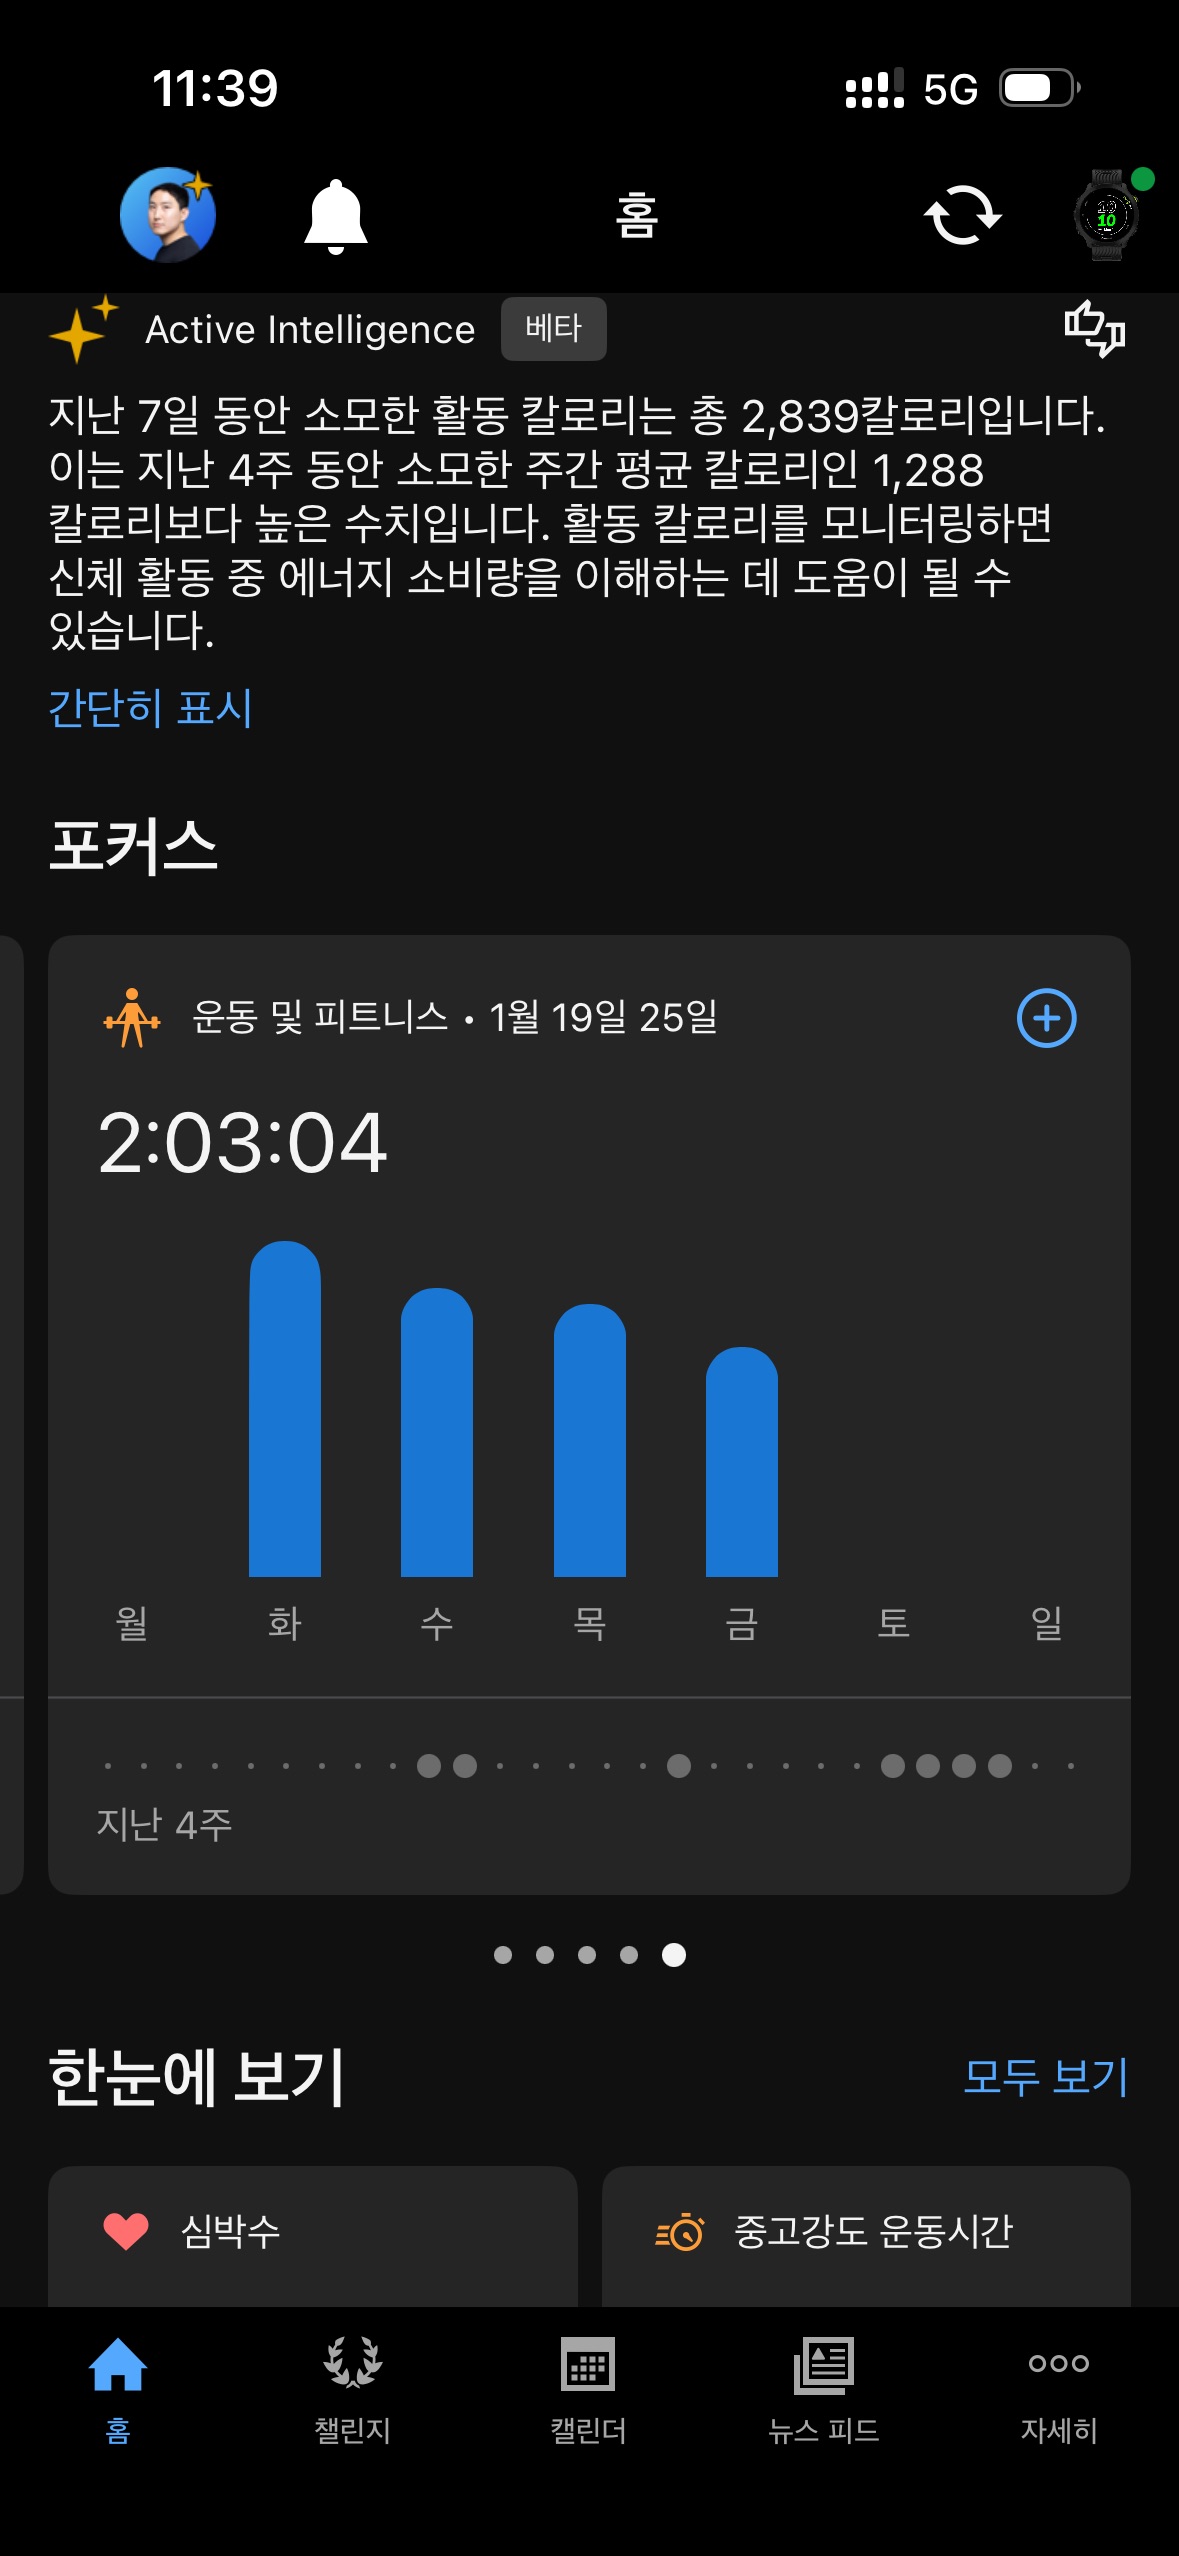
Experiment period: 1 week (January 19-25, 2026)
Metrics used:
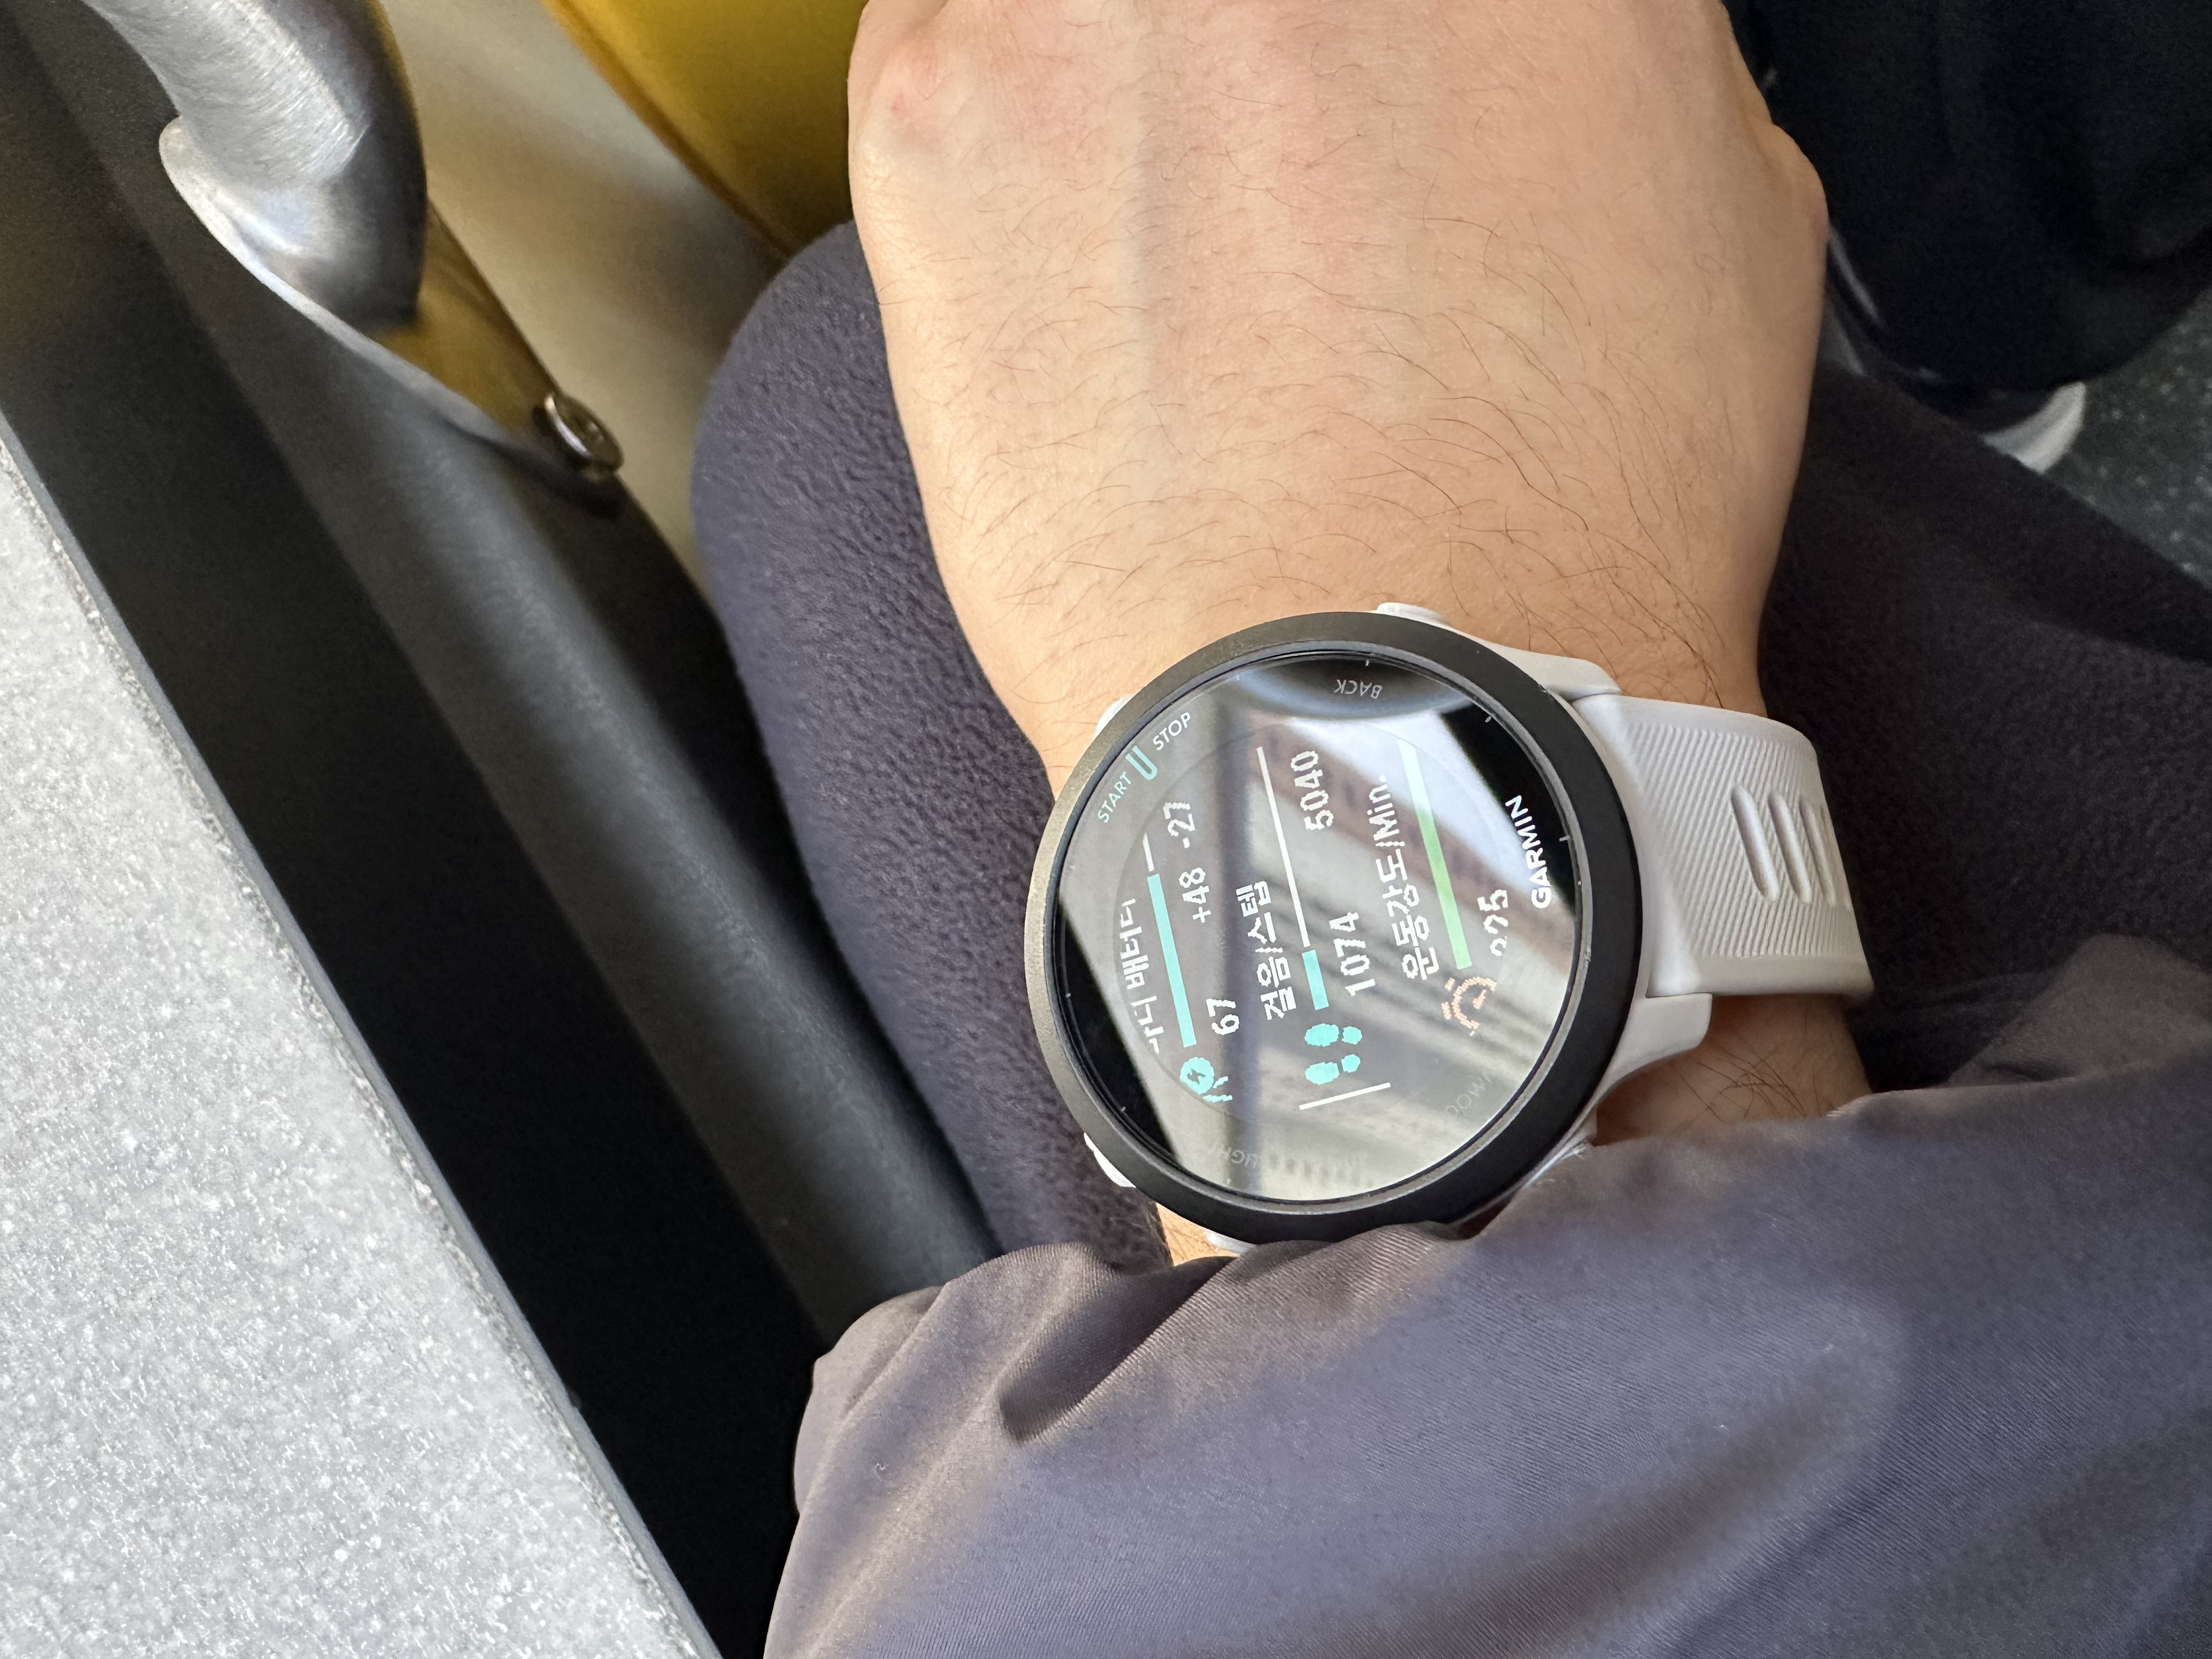
- Garmin Body Battery
- Garmin Stress Index
What I recorded together:
- Pre- and post-workout state
- Subjective condition, fatigue level
- Exercise motivation
- Pain presence and location
- Notable events (sleep fragmentation, daily routines, etc.)
Core question: “Are these metrics sufficient for designing a sustainable rhythm?”
3. Observation ①: The Day Marked as Recovery Was Actually Tough
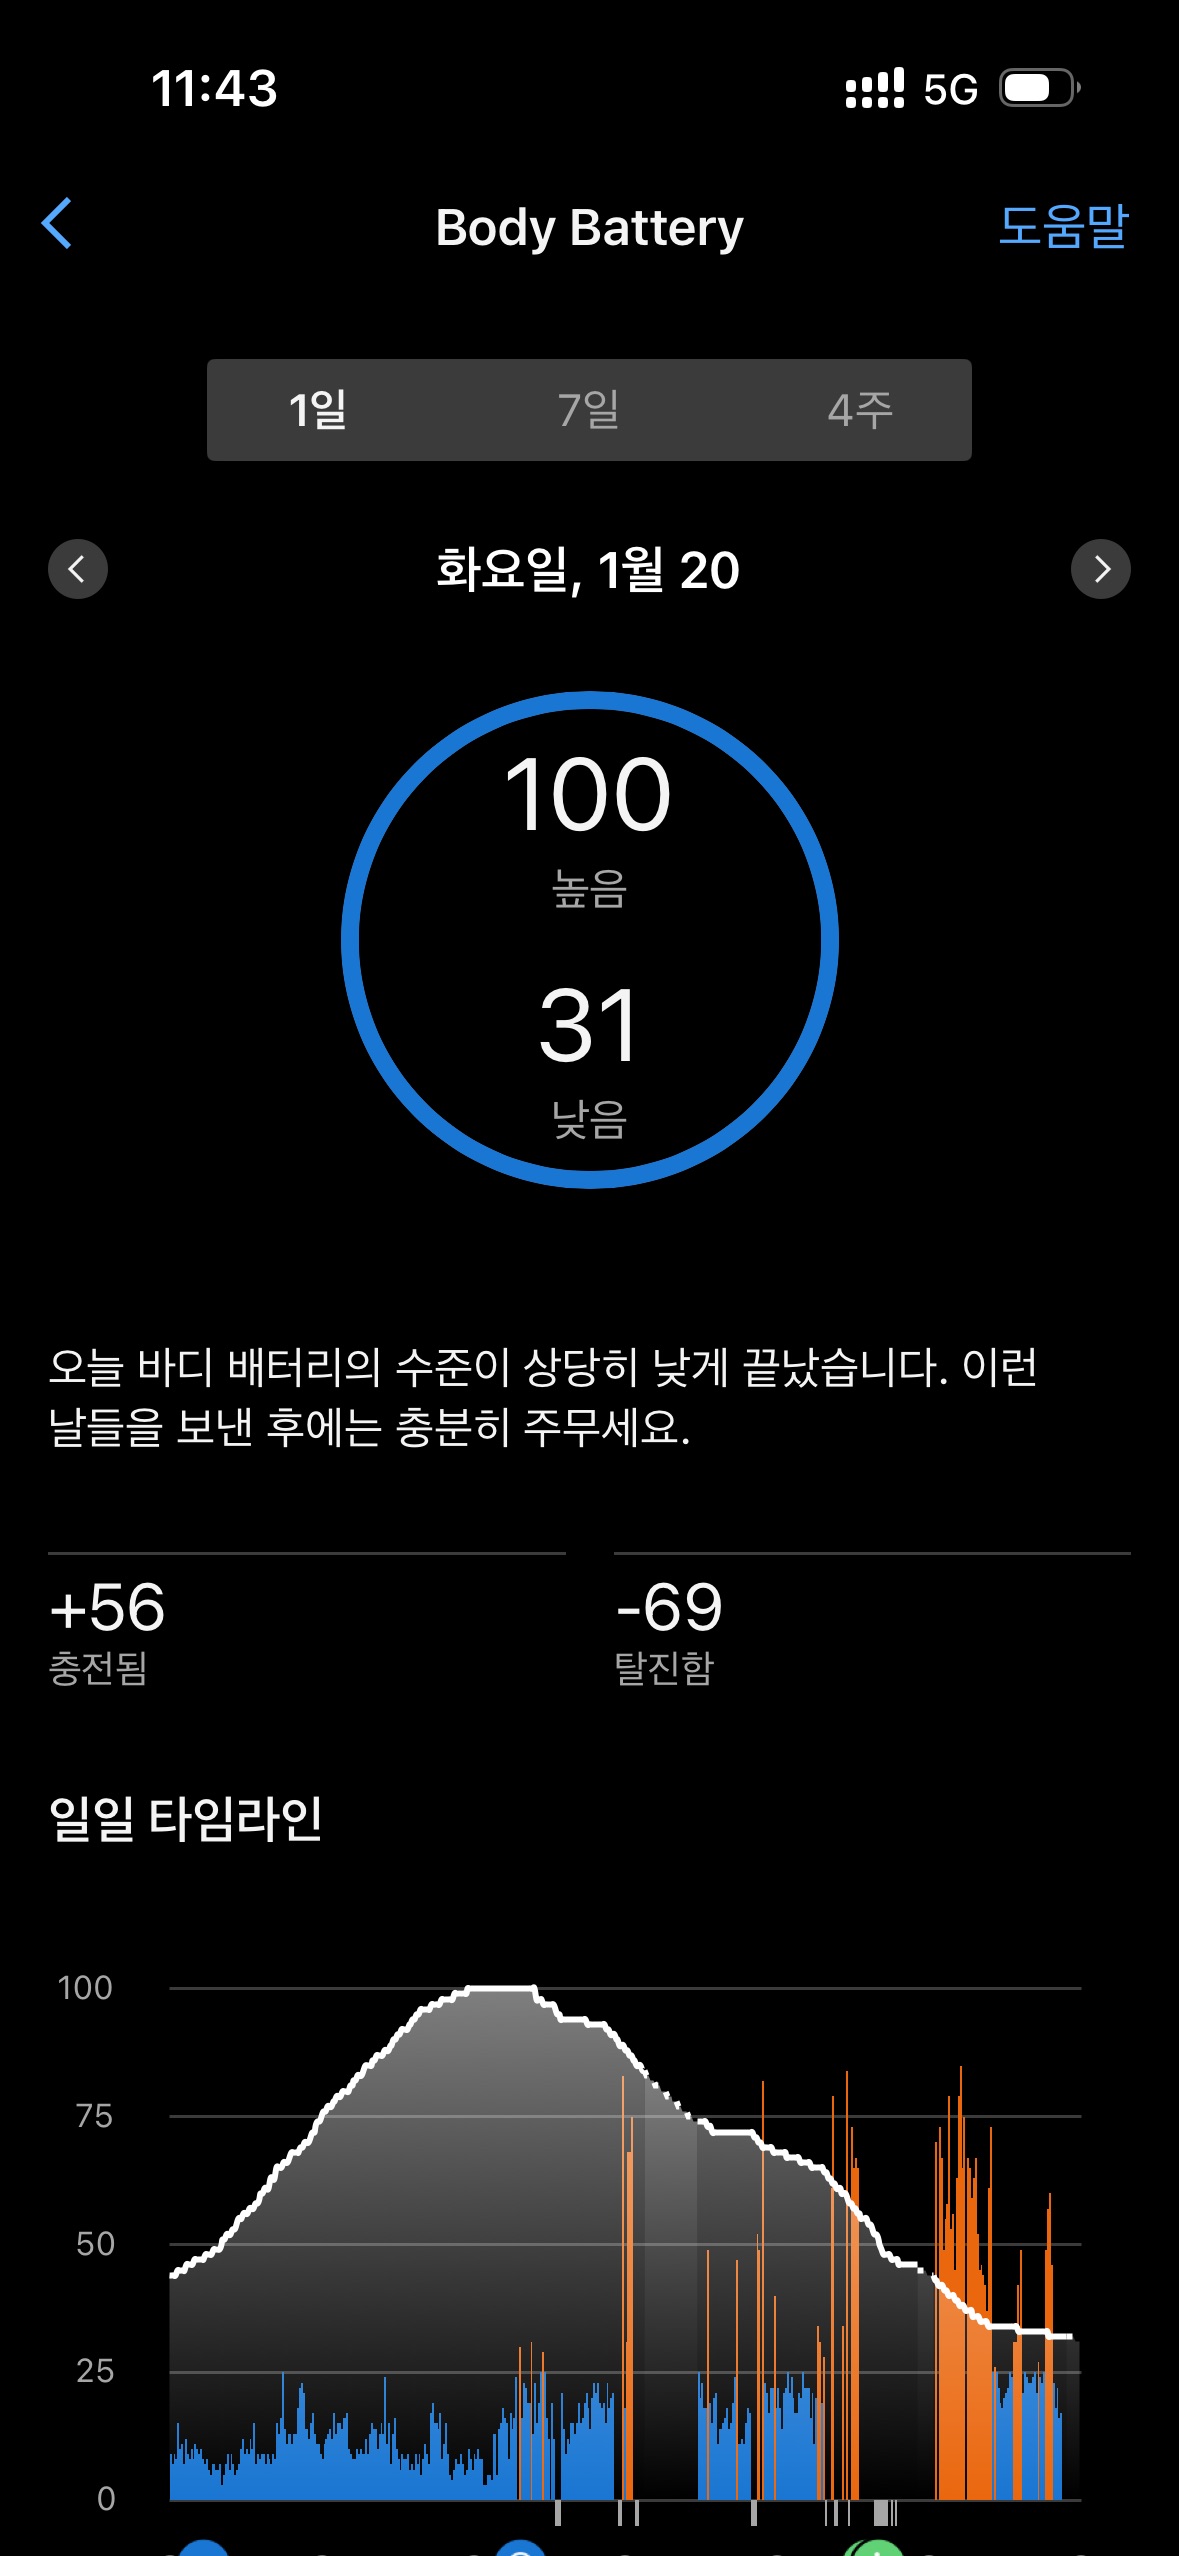
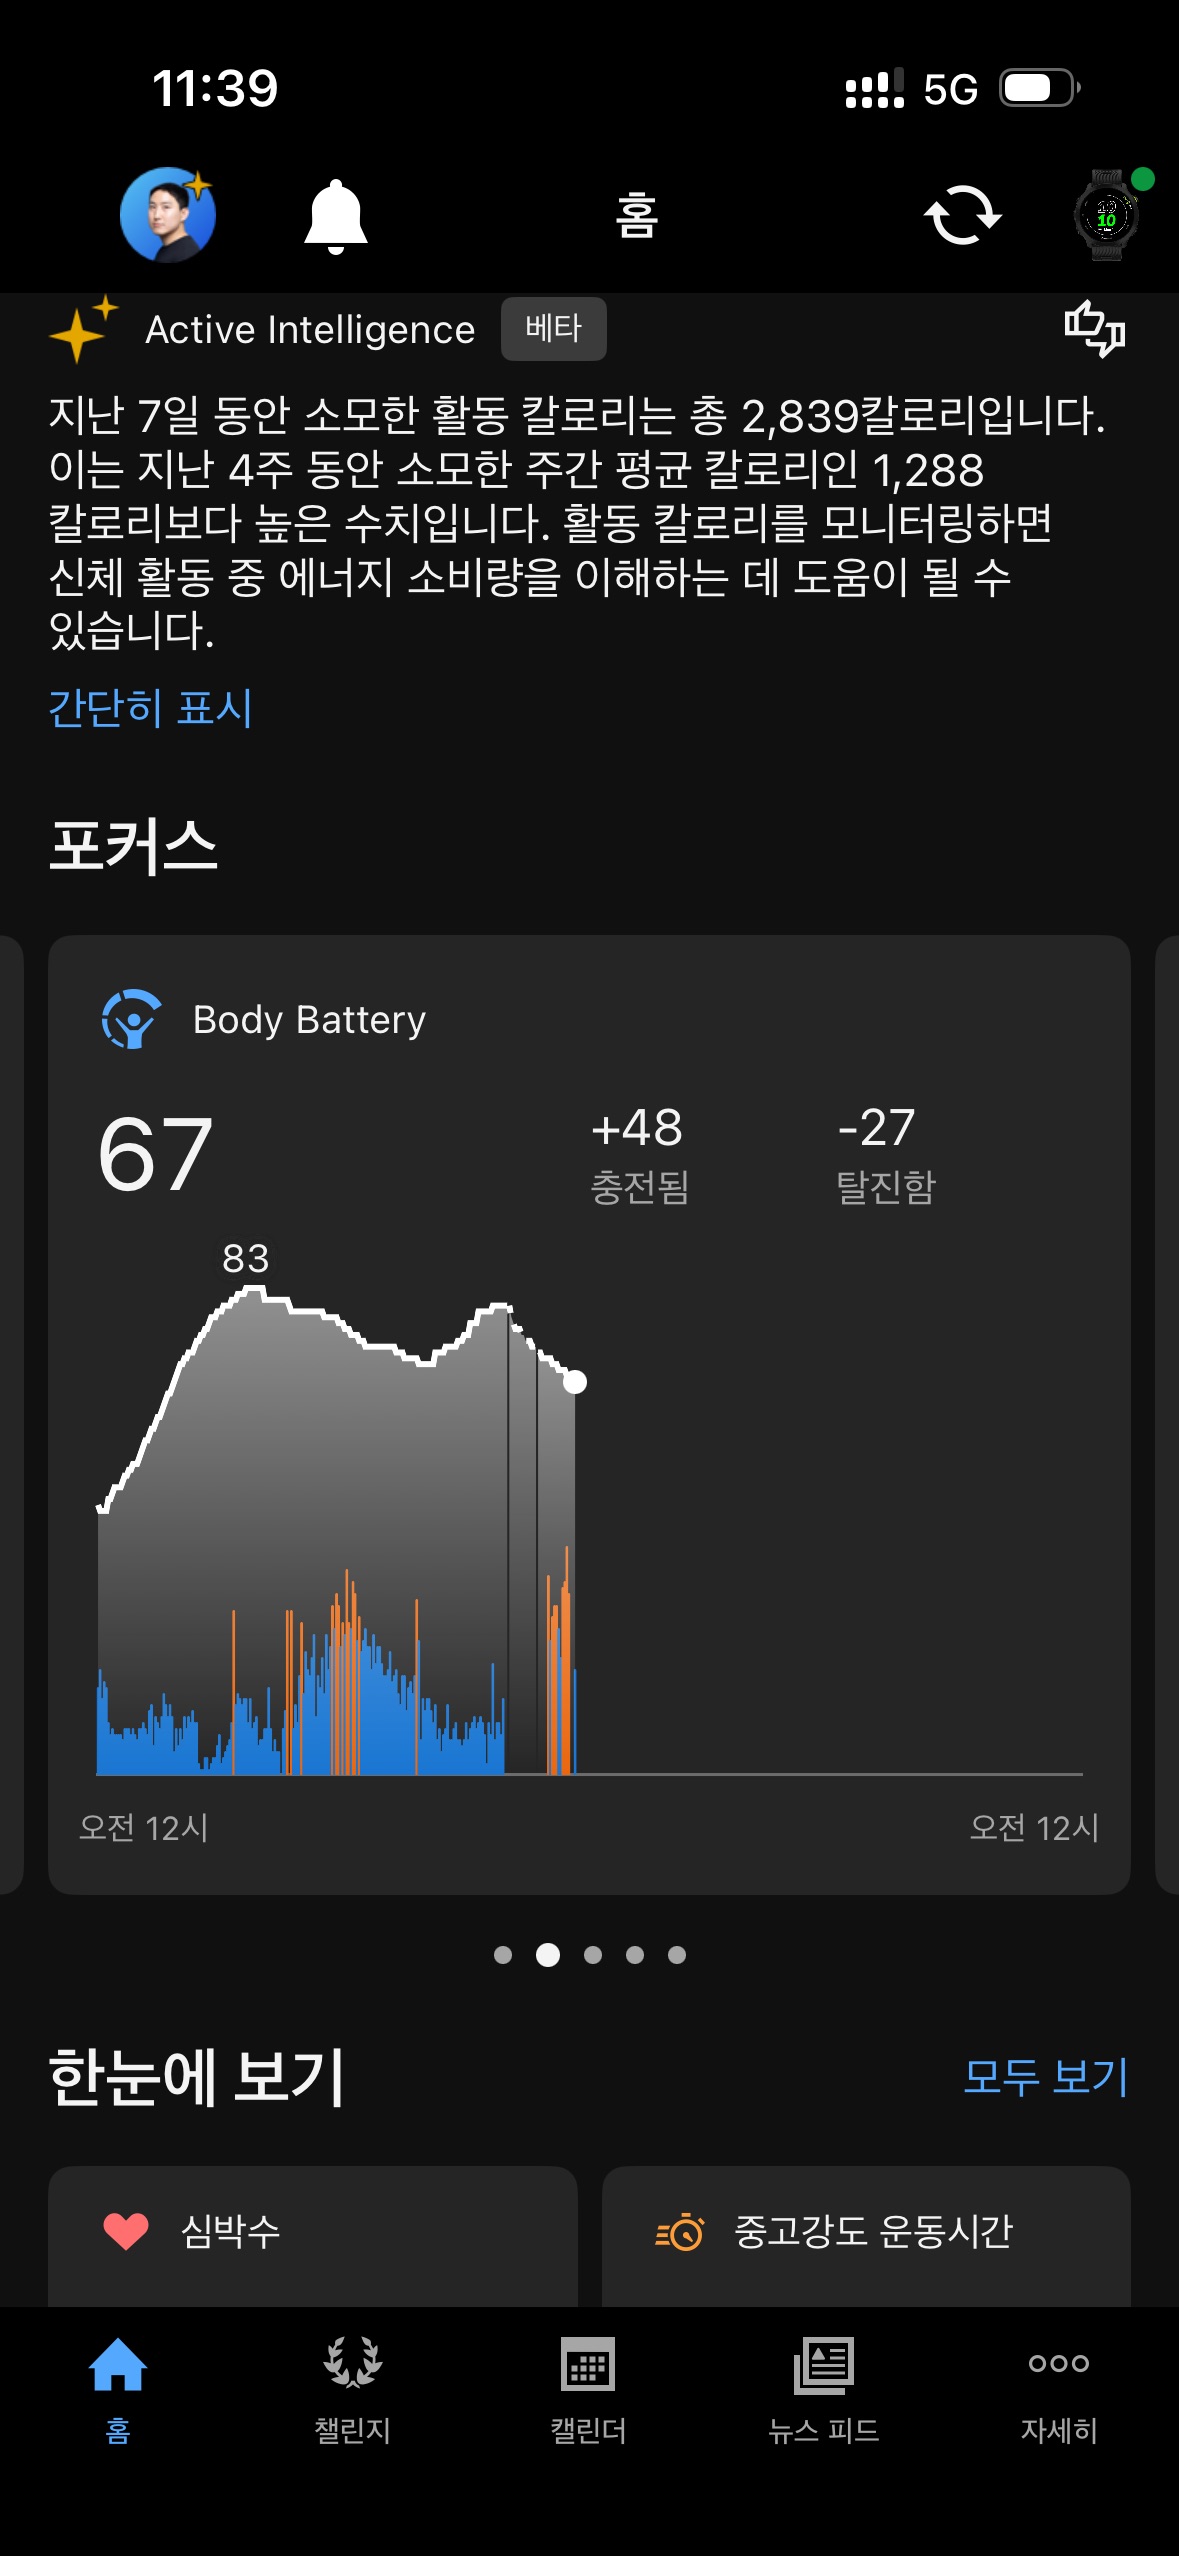
― Body Battery was 100, but it was actually tough
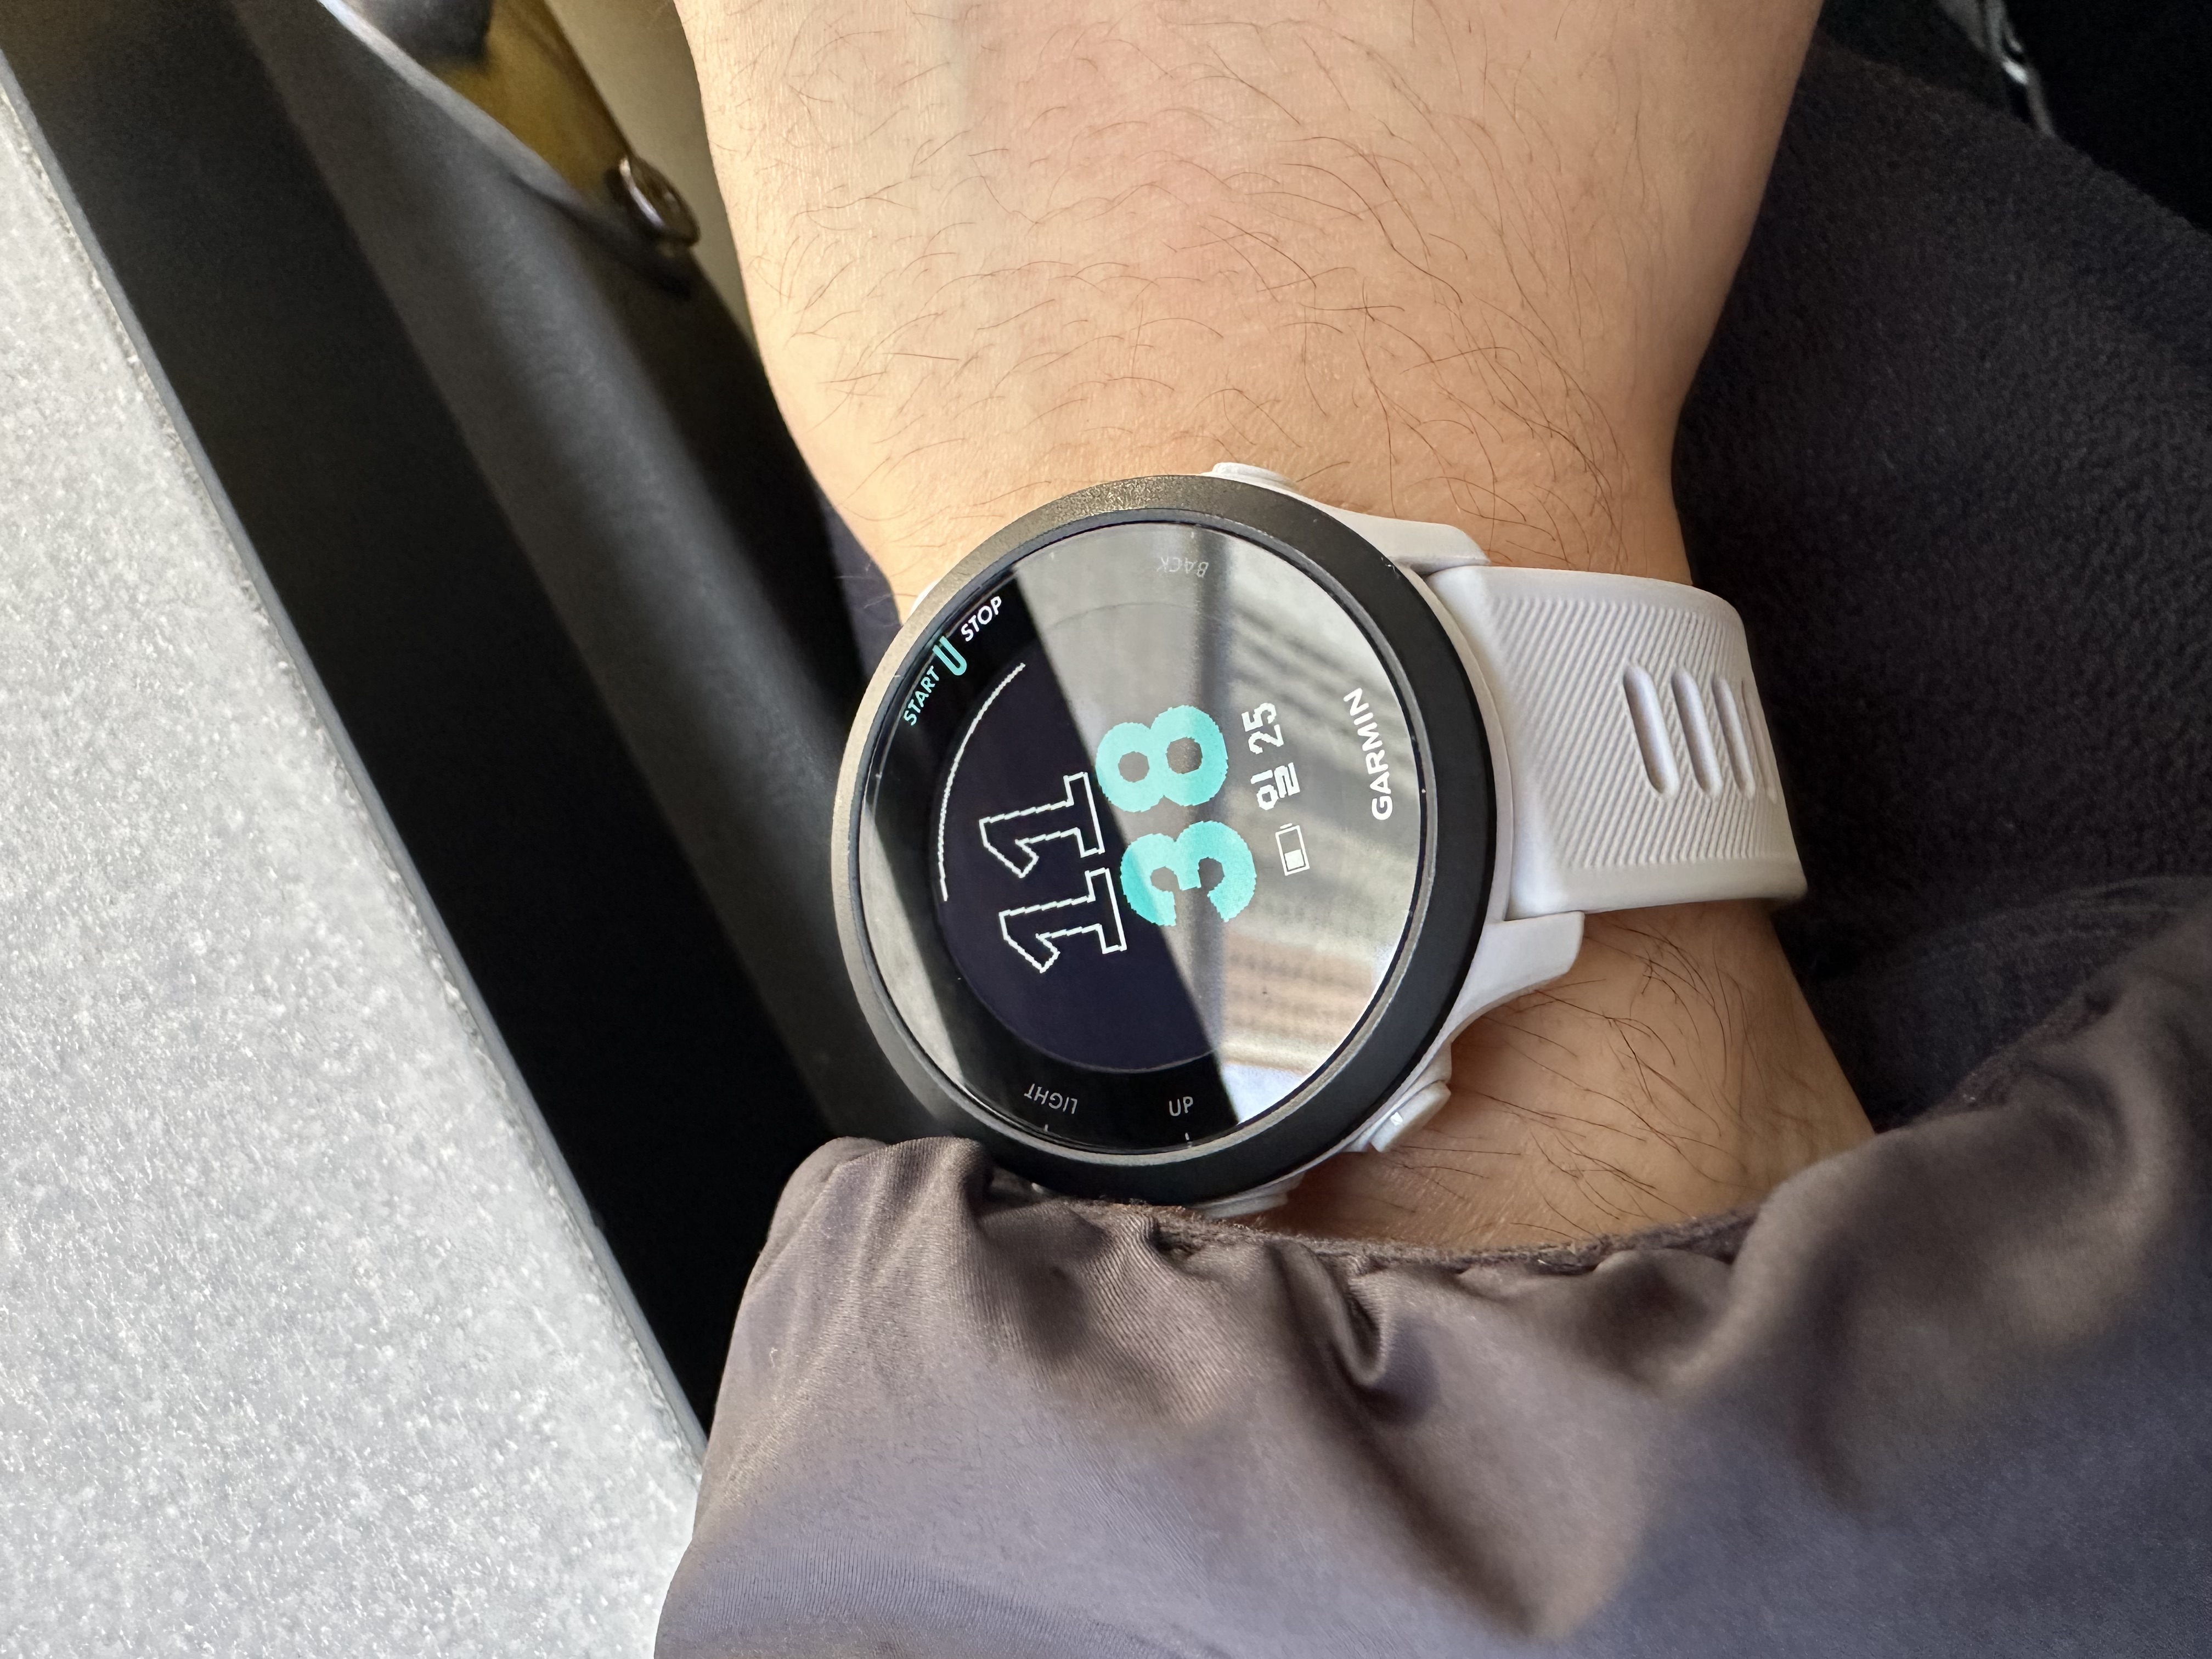
Tuesday morning, Body Battery was 100.
Average stress was also low at 13.
Garmin’s suggestion was “51 minutes of base fitness, 135bpm.”
But the actual feeling was different.
Condition 50, fatigue 50, exercise motivation 60.
In fact, the previous day (Monday), I couldn’t perform the WOD due to accumulated shoulder fatigue, so I did jogging instead.
Body Battery tells you the amount of energy, but it doesn’t tell you whether it’s a day to use that energy for a WOD.
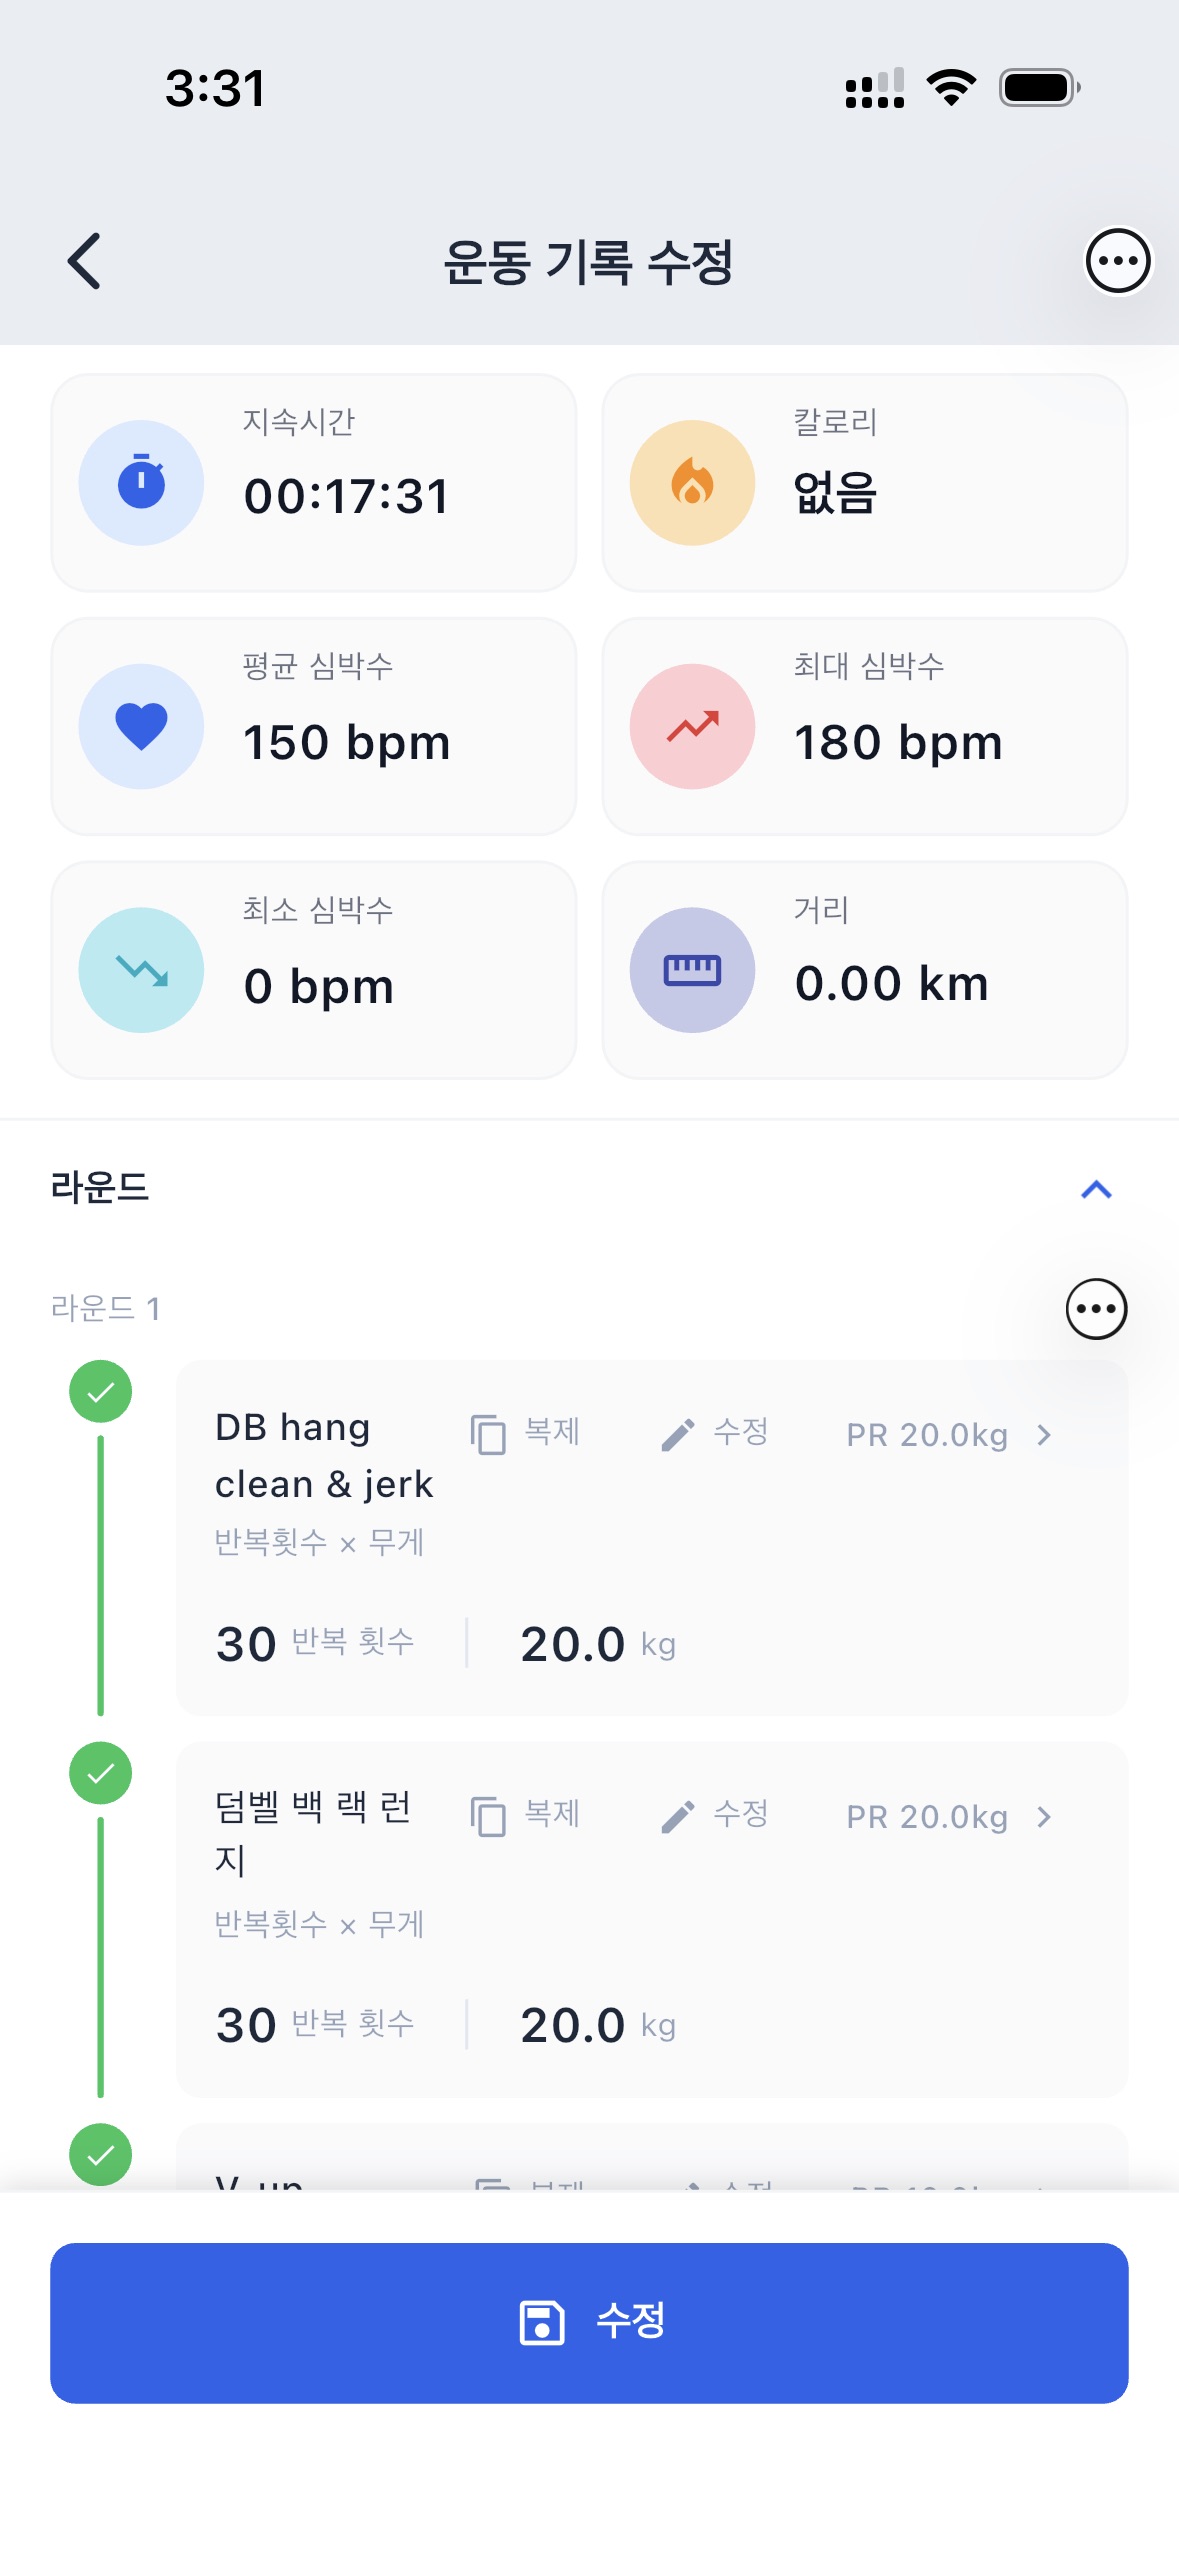
Today’s workout was FOR TIME 17 minutes Rxd complex joint movement.
It included dumbbell clean and jerk, so I chose Scale B.
Body Battery before the workout was 63.
It dropped to 46 immediately after, and plummeted to 34 after 1 hour.
After 3 hours, it recovered slightly to 37, but was still at a low level.
Body Battery was closer to a lagging indicator.
It only reflected what had already happened, insufficient for designing future rhythm.
In a situation where shoulder fatigue had already accumulated, joint fatigue and nervous system fatigue from complex joint movements were areas Garmin couldn’t track.
Garmin’s suggestions were only binary: “increase/decrease intensity.”
Without information on “why did I feel fatigue?”, I couldn’t answer So What, What’s Next.
4. Observation ②: Stress Was Low, But Recovery Failed
― Average stress 30, but condition was at its lowest
Thursday, average stress index was 30.
Morning Body Battery was high at 92.
But condition was 30, fatigue was 85.
High stress duration was also Yes.
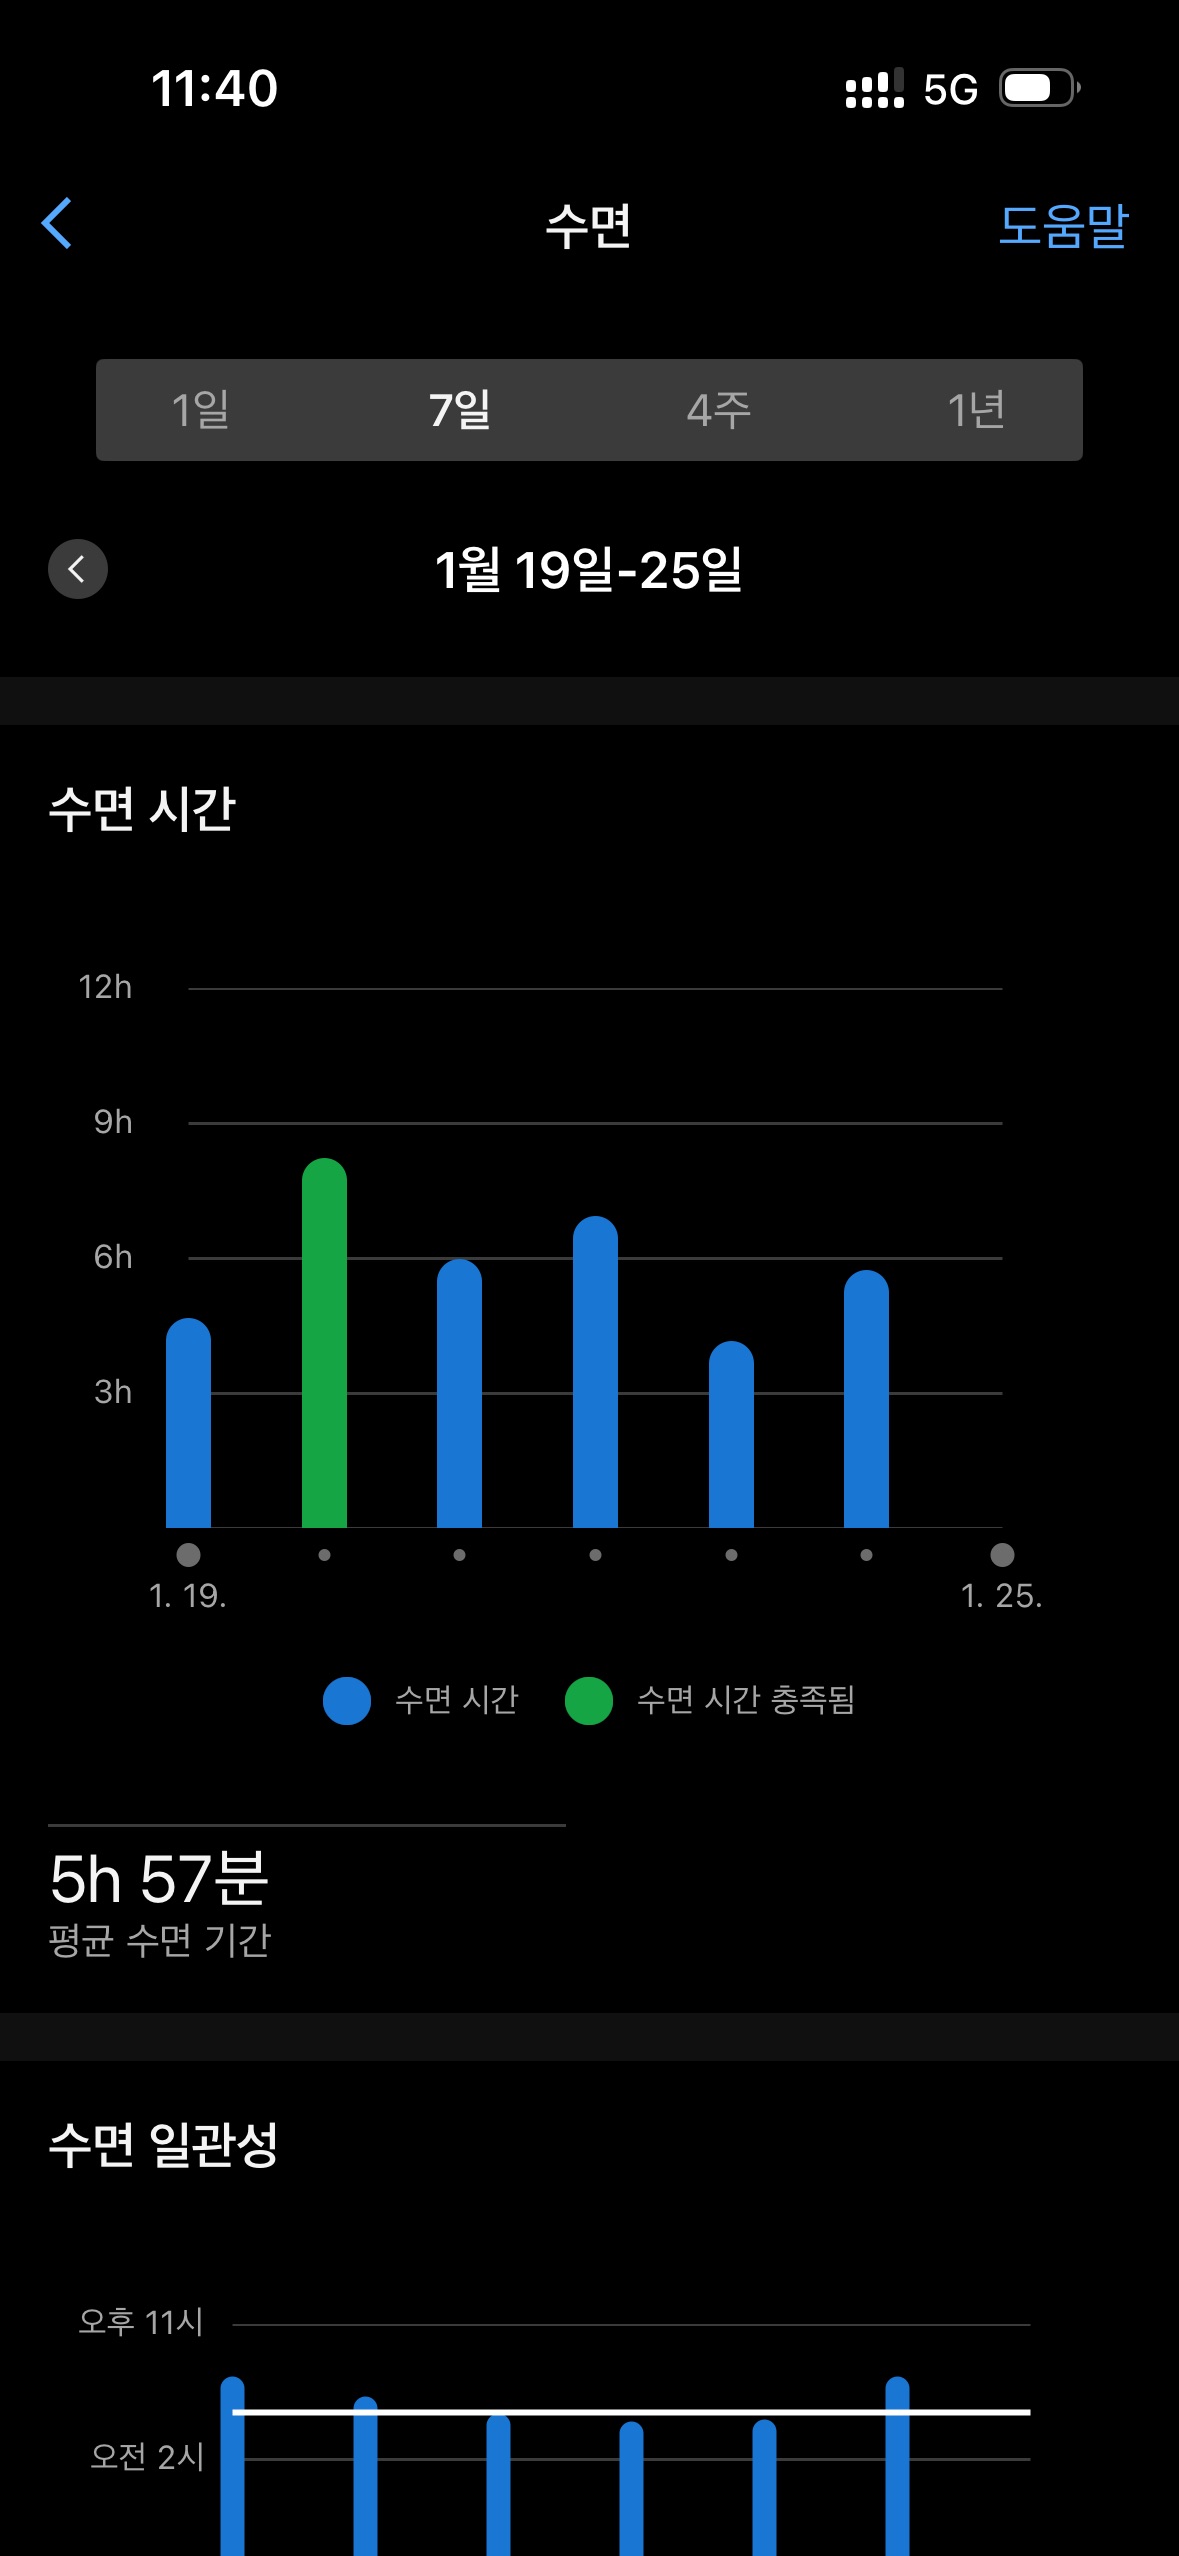
Personally, my allergic rhinitis was getting worse. I didn’t turn on the humidifier the night before, so I woke up in the early morning, resulting in insufficient sleep.
Body Battery was high, but without logging life events, I missed the comprehensive fatigue level.
Medical conditions like rhinitis and nasal congestion causing sleep fragmentation were things Garmin couldn’t track.
Joint fatigue and nervous system fatigue were the same.
5. Observation ③: Averages Were Fine, But This Rhythm Couldn’t Be Repeated
― Body Battery alone was insufficient for designing a week-long rhythm
Daily metrics were mostly “no problem.”
But condition and fatigue deteriorated cumulatively.
Monday: Condition 70, Fatigue 70
Tuesday: Condition 50, Fatigue 50
Wednesday: Condition 40, Fatigue 80
Thursday: Condition 30, Fatigue 85
Friday: Condition 30, Fatigue 80
Saturday: Condition 50, Fatigue 80
Body Battery alone was insufficient for designing a week-long rhythm.
Limitations of Body Battery:
- Lagging indicator: Only reflects what has already happened
- Single metric: Not integrated with other factors like exercise motivation, condition, fatigue
- Binary suggestions: Only offers “increase/decrease intensity,” no root cause analysis
Change in core question:
- “Was today okay?” ❌
- “Can I maintain this pattern for 3 days, 7 days, a month?” ⭕️
6. Turning Point: The Problem Wasn’t the Metrics, But the Unit of Interpretation
― A new system is needed to integrate exercise motivation and physical energy
Organizing the fundamental limitations of Body Battery:
- Lagging indicator: Only reflects what has already happened, insufficient for future rhythm design
- Single metric: Not integrated with exercise motivation, condition, fatigue, etc.
- Binary suggestions: Only offers “increase/decrease intensity,” no root cause analysis
- No answer to So What, What’s Next: Lack of information on “why did I feel fatigue?”
What Garmin couldn’t track:
- Medical conditions like rhinitis, nasal congestion (causes of sleep fragmentation)
- Joint fatigue (accumulated joint fatigue after complex joint movements)
- Nervous system fatigue (central nervous system recovery needed after high-intensity exercise)
- Life events (laundry, nasal rinsing, etc., daily routines)
- Exercise motivation (psychological factor separate from physical energy)
Factors that actually affected rhythm design:
- Exercise intensity, type, timing
- Continuity rather than total sleep amount
- Medical conditions (rhinitis, nasal congestion)
- Joint/nervous system fatigue (characteristics of complex joint movements)
- Unexpected daily events
- Mismatch between exercise motivation and physical energy
Numbers are just materials; the center of interpretation must be ‘me.’
To design a week-long rhythm, a new system is needed that integrates exercise motivation and physical energy to properly spend and recharge over a week.
7. Conclusion: A Personalized Algorithm Is Needed for a Sustainable Life Rhythm
― Limitations of existing systems and need for new systems
Limitations of existing systems:
- Body Battery alone is insufficient for week-long rhythm design
- Too close to lagging indicators, difficult to use for future design
- Only provides binary suggestions, no root cause analysis
- No answer to So What, What’s Next
New system needed:
- Exercise data (intensity, type, timing)
- Medical/physical data (rhinitis, joint fatigue, nervous system fatigue)
- Daily events (daily routines, unexpected events)
- Subjective perception (condition, fatigue)
- Exercise motivation (psychological factor separate from physical energy)
- Integrated interpretation: Rhythm design that integrates exercise motivation and physical energy to properly spend and recharge over a week
Change in questions:
- “Can I do more?” ❌
- “Can I live with this rhythm tomorrow too?” ⭕️
- “Why did I feel fatigue?” → “So What?” → “What’s Next?” ⭕️
8. Epilogue: So I Decided to Record Sequence, Not Scores
― From performance-centered to sequence-centered
A shift was needed from performance-centered recording to sequence, flow, and recovery possibility-centered.
Need for new systems:
- Week-long rhythm design integrating exercise motivation and physical energy
- Rhythm design based on leading indicators, not lagging indicators
- Root cause analysis of “why did I feel fatigue?” rather than binary suggestions
- Clear answers to So What, What’s Next
This article is a reference point for the next experiment, the starting line for the problem sqnc.today aims to address.
Questions for readers:
- “Do your numbers describe the rhythm of your life?”
- “Are your metrics sufficient for designing a week-long rhythm?”
- “Are you managing by integrating exercise motivation and physical energy?”
[Next Sequence]
This sequence was
a week of experiencing the limitations of wearable metrics
and discovering the complexity of week-long rhythm design.
In the next installment, I’ll
- explore methods to integrate subjective perception and objective metrics
- search for rhythm design systems that integrate exercise motivation and physical energy
- attempt a new approach that provides answers to So What, What’s Next
The next log will continue with
integrating subjective awareness and objective monitoring.